Chart Topping Blog Madness 📊
My blogging platform provides me with some limited stats. It's enough to let me see if people are actually reading articles.
It doesn't drive my blogging, or make me change my content or style. I write for me and for fun, on a wide range of topics. If others enjoy it along the way that's great.
People do seem to read my blog. Thank you to everyone.
Gone viral
I'm assuming the phrase gone viral implies a post has become very popular?
A few days ago one of my posts was obviously featured on a mainstream service. That one post has been read over 14 thousand times!
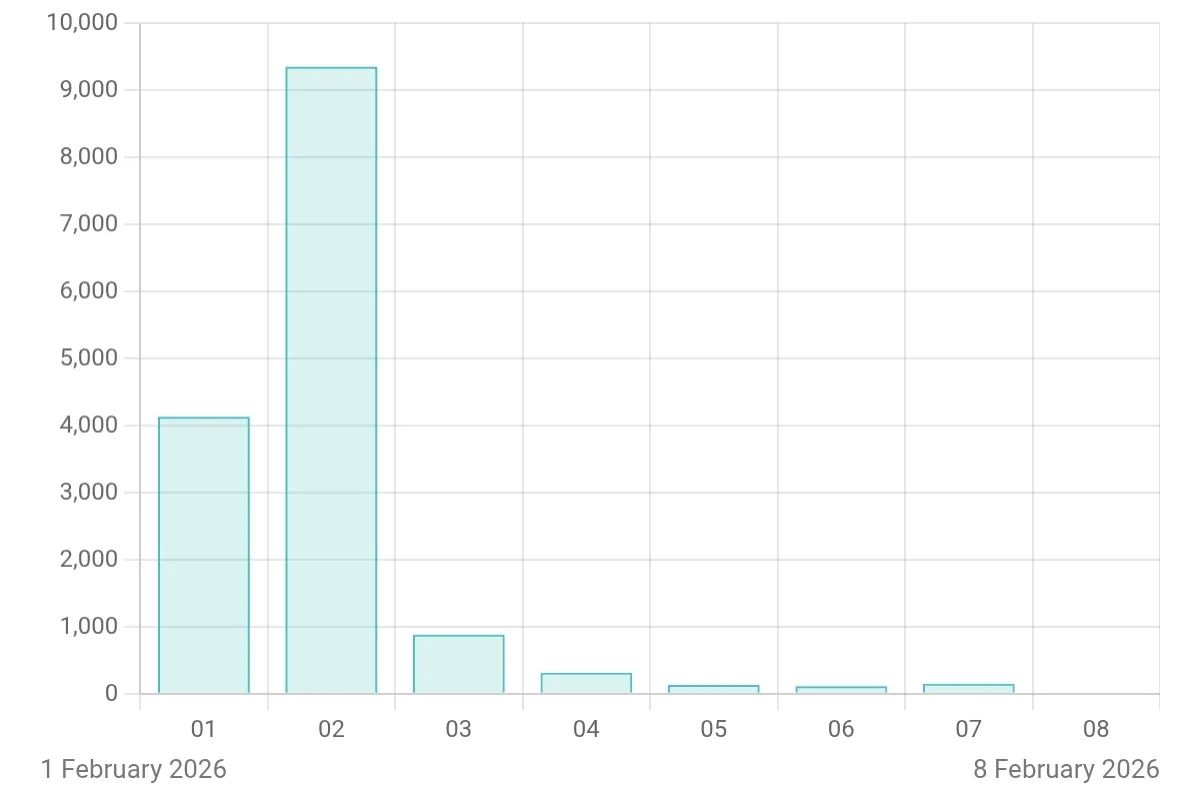
Chart Distortion
You can see the problem. When I look at my daily reads on the chart, every other day appears so minuscule. It looks like it has almost flat lined.
On a typical day I average around 250-300 reads, sometimes more, and less too.
That for me is amazing. It blows my mind that I have a great readership. I'm so touched by that.
Bots?
I was discussing this with someone the other day as they'd suggested it may be bots or AI inflating the stats.
However, I've read that the tech behind the scenes, counting page reads, has features to help ensure it's a person reading. For example: did they move the mouse orr trigger a touch.
The future chart
In a few days the huge column will fall off the weekly chart. However it will remain on the monthly and yearly for much longer.
Once again, to everyone who does read... Thank you so much. I'm delighted if even one person is interested in my ramblings. Hugz.
Leave a Comment; Or copy this post id and search for it in your Fediverse client to reply; Or send a message. If you have replied with your own blog post and I will mention it here.
https://gofer.social/@daj/statuses/01KGYJENZ7CTFTK2XSPEXHH84C